Michal Sojka
Zdeněk Šebek
To run the development environment, use icon Wind River Workbench 2.3 on your desktop, or choose Start->Programs->Wind River->Wind River Workbench->Wind River Workbench 2.3. The following dialog appears.
Working directory (workspace) is space, where will be stored your projects. It's recommended to use a directory on your G disk.:
During the first start welcome screen appears, we choose Start and in the next screen Wind River Workbench.
Then you will see the main window of development environment.
New projects can be created by choosing File->New->VxWorks Downloadable Kernel Module Project. A dialog window opens and we enter location and the name of the project. We will continue by pressing Next.
The next dialog will be left without modifications unless we want to create our own makefiles. Continue by pressing Next.

In the next dialog we check the Active build spec is set to SIMNT diab. Continue by pressing Next.
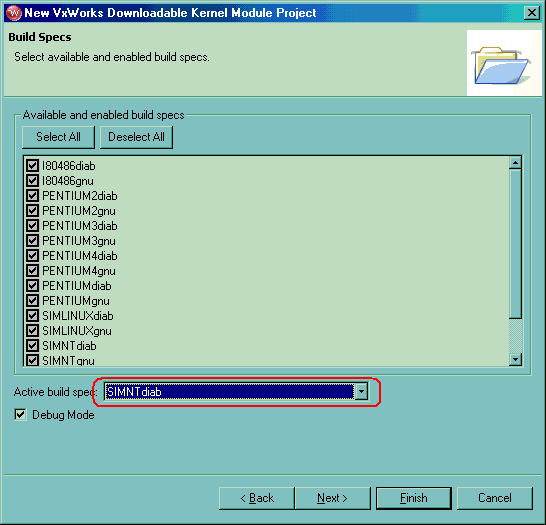
In the next dialog, there is nothing to change. We will finish creation of the new project by pressingFinish.

We can see our new project in in the Project Navigator tab.

There is no source code in project yet. We will create a new file containing the C code. We will choose File->New->File and in the next dialog we enter the desired name of the file.
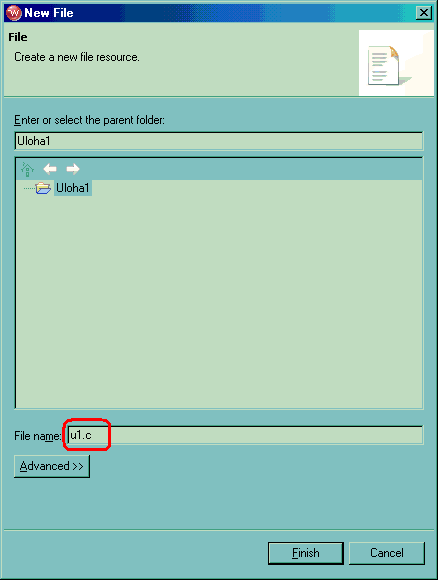
The newly created file is immediately open in the IDE, but unfortunately it is empty. We will copy there the content of the example file here. The result should look like this:
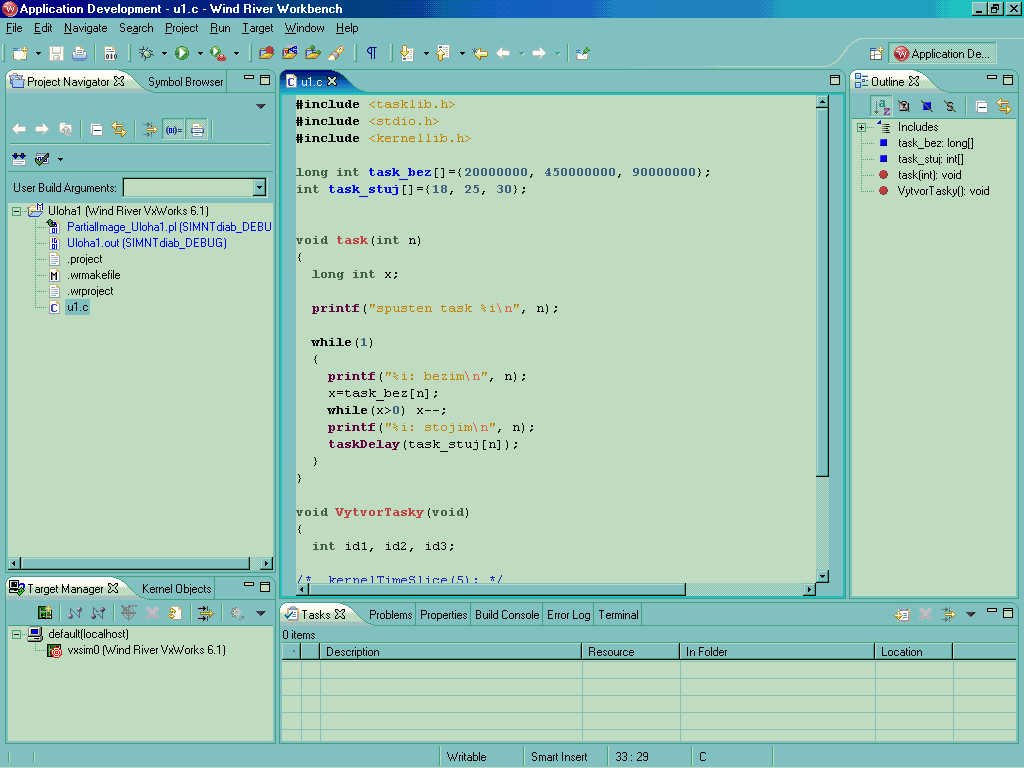
Build process can be run by Project->Build All or Project->Build Project. Build progress can be watched in the Build Console tab.
It is necessary to run compiled application somewhere. We will use a simulator instead of real target hardware. If the simulator is already configured, we can just run it and connect to it. Booth can be done in one step by pressing Connect vxsim0 button in Target Manager tab.
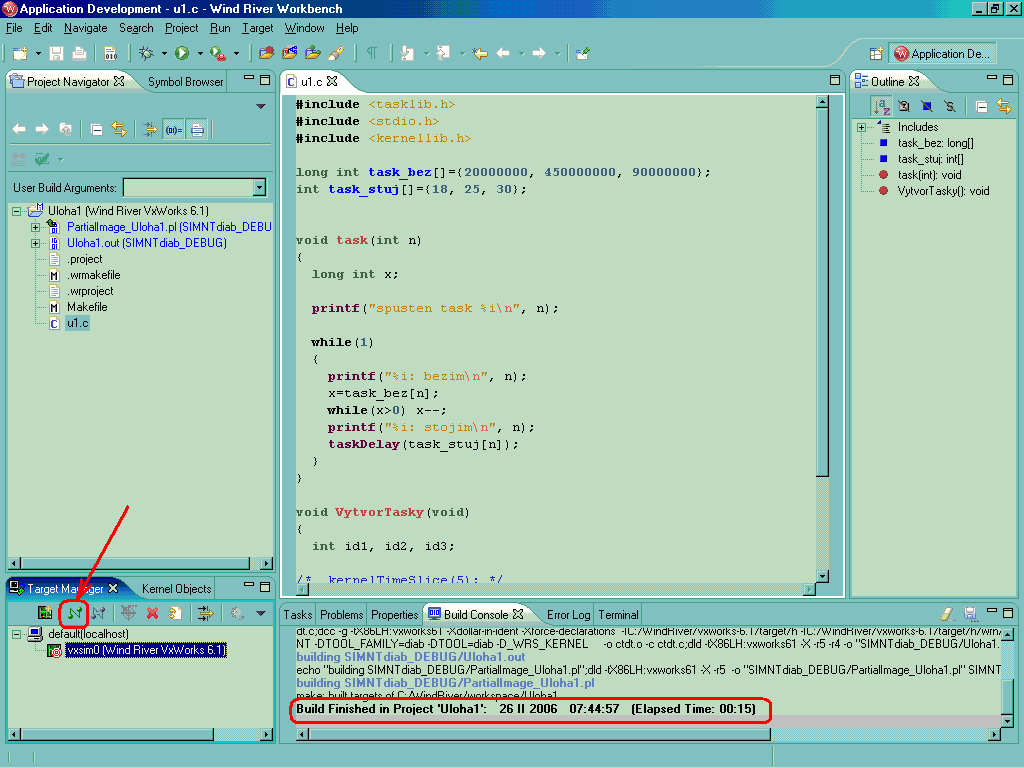
If there is no vxsim0 field in Target Manager tab, we should create the simulator by clicking the Create a New Target Connection button.

Then select the Simlator and press Next:

Leave this, let all the following dialog unmodified and keep pressing Next.
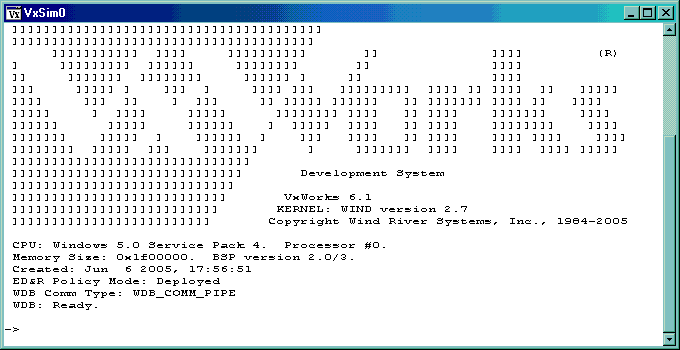
Simulator is executed in a standalone window.
Information about the simulator appears in the IDE.

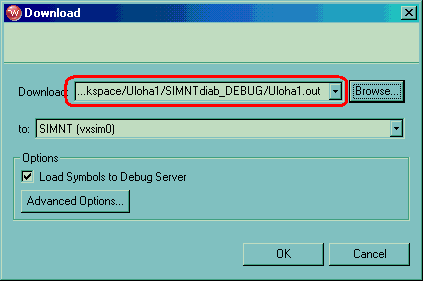
Now, we load the compiled application to the simulator using the Show download dialog button (see the previous figure). In the dialog we must specify the path to the compiled binary file (in our case Task1.out or Uloha1.out)
Running the application can be done in the simulator window by the command sp CreateTasks. The sp command creates a new task, CreateTasks is the name of the function, which is the entry point for our application. In the following figure, there is also the command i, which prints the list of running tasks.
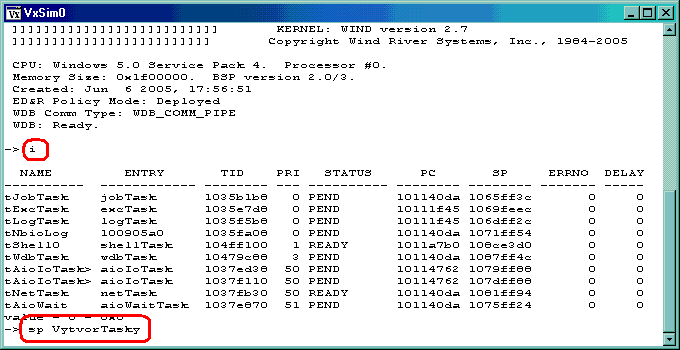
We can see that our application immediately started to print something to simulator window and so it is not usable for entering other commands. It is possible to run standalone Target Shell using the command from context menu (right button) of vxsim0 item in Target Manager tab. In this menu we choose Target Tools->Host shell. This shell is useful if we want to end our application. We can use the td command for this e.g. td Task1 etc.
Instead of downloading the application manually and running it from the Target Shell, it is possible to let the IDE do all the necessary steps instead of us. After program is compiled, select Run Kernel Task from the project's context menu.

If
you are not connected to some target select one and click Connect,
then specify the name of Entry Point
function and press Run.

From now on, you can press the Run button on the toolbar to start the simulator, download your application and run it.

System viewer is a tool that allows us to see what happens inside operating system. It is possible to log various events (changes in process states, context switches, IPC events) and display them offline. System viewer can be run from context menu of vxsim0 in Target Manager tab, we choose Target Tools->System viewer configuration.
In the configuration dialog, we select which events we want to log. We can choose either only context switches or changes in task states. We can also alternatively select all the event one by one – for example all event from semaphores and message queues.
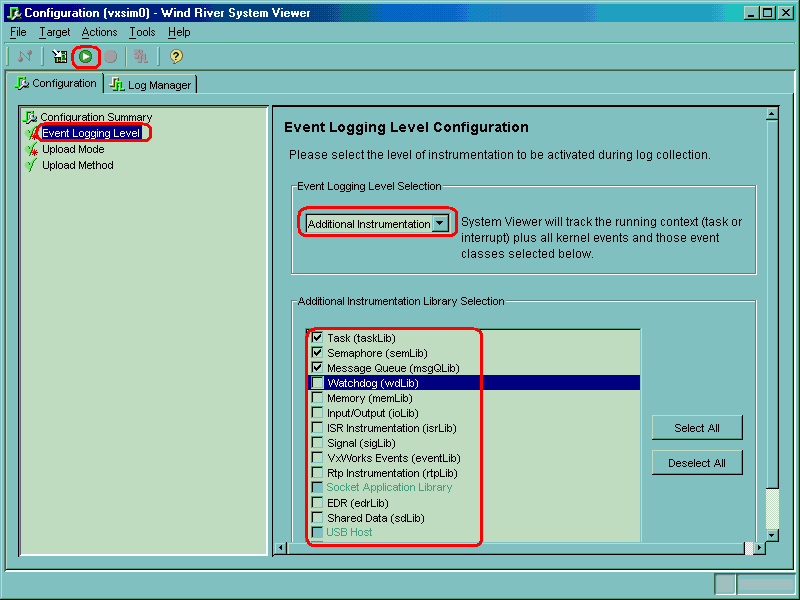
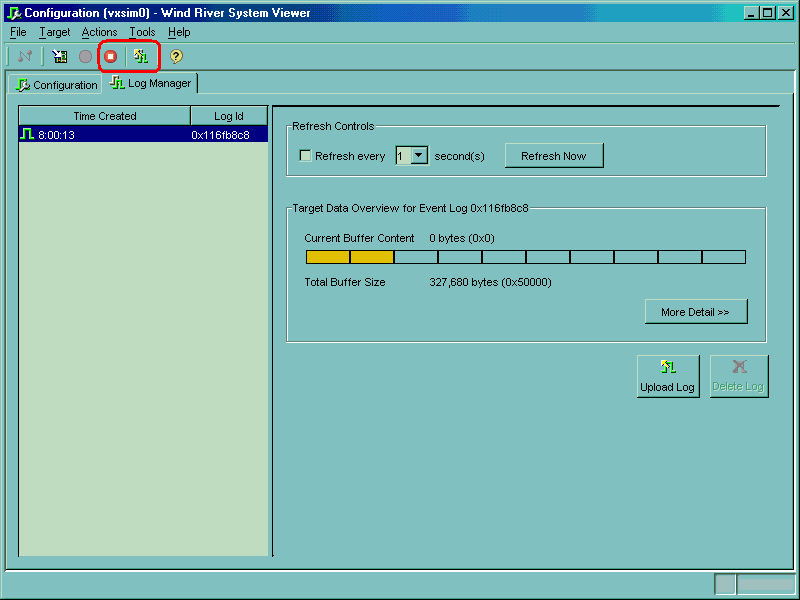
After configuration is done, we can start logging by pressing Start System Viewer logging button. We let logging run for some time (let say 10 – 20 seconds) and then we press Stop System Viewer logging button to end up logging. By pressing Start uploading all event logs on the target we will display the logged events on timeline.
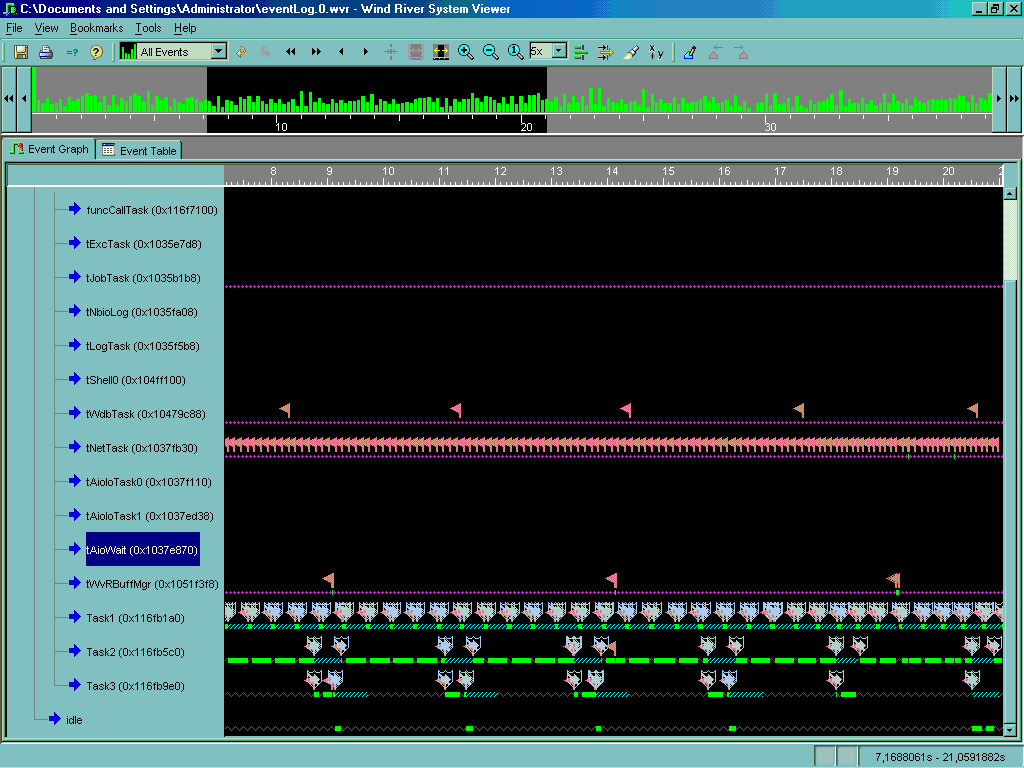
We can show the Legend from the Help menu.
